Microsoft Power BI – เครื่องมือวิเคราะห์ข้อมูลอัจฉริยะสำหรับองค์กร
Power BI ไม่ได้เป็นเพียงเครื่องมือ แต่เป็นชุดของบริการซอฟต์แวร์ แอปพลิเคชัน และตัวเชื่อมต่อที่ทำงานร่วมกันเพื่อแปลงแหล่งข้อมูลที่กระจัดกระจายและไม่เกี่ยวข้องกันให้กลายเป็นข้อมูลเชิงลึกที่สอดคล้องกัน แสดงผลด้วยภาพที่น่าสนใจ และสามารถโต้ตอบได้ วัตถุประสงค์หลักของ Power BI คือการอำนวยความสะดวกให้กับระบบธุรกิจอัจฉริยะ (Business Intelligence) โดยช่วยให้ผู้ใช้สามารถเชื่อมต่อกับข้อมูล แสดงภาพสิ่งที่ค้นพบที่สำคัญ และแบ่งปันข้อมูลเชิงลึกเหล่านี้ไปทั่วทั้งองค์กรได้อย่างง่ายดาย
คุณค่าทางธุรกิจของ Power BI อยู่ที่ความสามารถในการเสริมศักยภาพให้องค์กรตัดสินใจโดยอาศัยข้อมูล (Data-Driven Decisions) ระบุแนวโน้ม ติดตามตัวชี้วัดประสิทธิภาพหลัก (KPIs) แบบเรียลไทม์ และท้ายที่สุดคือการสร้างความได้เปรียบในการแข่งขัน Power BI ทำหน้าที่เป็นสะพานเชื่อมระหว่างข้อมูลดิบและการดำเนินการเชิงกลยุทธ์ เครื่องมือนี้ได้รับการออกแบบมาสำหรับผู้ใช้ที่มีระดับความรู้ด้านข้อมูลที่แตกต่างกัน ทำให้การวิเคราะห์ที่ซับซ้อนสามารถเข้าถึงได้ง่ายขึ้น ไม่จำกัดเฉพาะผู้เชี่ยวชาญด้านข้อมูลเท่านั้น

Power BI เหมาะสำหรับใคร?
Power BI รองรับผู้ใช้งานหลากหลายกลุ่ม ตั้งแต่นักวิเคราะห์ข้อมูลไปจนถึงผู้ใช้งานทางธุรกิจและนักพัฒนา:
- นักวิเคราะห์ธุรกิจ (Business Analysts): มักใช้ Power BI Desktop หรือ Power BI Report Builder อย่างกว้างขวางในการสร้างรายงานที่ซับซ้อนและแบบจำลองข้อมูล
- ผู้ใช้งานทางธุรกิจ/ผู้มีอำนาจตัดสินใจ (Business Users/Decision Makers): ส่วนใหญ่ใช้ Power BI Service และแอปพลิเคชันมือถือเพื่อดูรายงาน แดชบอร์ด และติดตาม KPIs แพลตฟอร์มนี้ได้รับการออกแบบโดยตั้งใจให้ใช้งานง่ายสำหรับผู้ใช้ที่ไม่ใช่สายเทคนิค
- นักพัฒนา (Developers): สามารถใช้ Power BI APIs เพื่อส่งข้อมูลเข้าสู่แบบจำลองความหมาย (Semantic Models) หรือฝังแดชบอร์ดและรายงานลงในแอปพลิเคชันที่พัฒนาขึ้นเอง และใช้ Power BI Embedded สำหรับโซลูชันแบบ White-label
- นักวิทยาศาสตร์ข้อมูล (Data Scientists): สามารถผสานรวมแบบจำลองปัญญาประดิษฐ์ (AI) และการเรียนรู้ของเครื่อง (Machine Learning) โดยใช้ Power BI เพื่อแสดงภาพการคาดการณ์และข้อมูลเชิงลึก

Promotion Power BI:
คุ้ม 2 ต่อ พร้อมข้อเสนอสุดคุ้ม!
- ฟรี! การติดตั้งการใช้งาน Power BI Pro/ Premium Per User บนระบบ Cloud
- ฟรี! พร้อมอบรมการใช้งานออนไลน์ และการดูแลให้บริการตลอดระยะเวลาการใช้งาน
ภาพรวมของระบบนิเวศ Power BI
ระบบนิเวศของ Power BI ประกอบด้วยองค์ประกอบหลักหลายส่วนที่ทำงานร่วมกัน ได้แก่:
| องค์ประกอบ | รายละเอียด |
|---|---|
| Power BI Desktop | แอปพลิเคชันสำหรับ Windows ที่ใช้สร้างและเผยแพร่รายงานไปยัง Power BI Service |
| Power BI Service | บริการ SaaS บนคลาวด์ (เดิมชื่อ Power BI for Office 365) สำหรับเผยแพร่ แชร์ และทำงานร่วมกันบนรายงาน |
| Power BI Mobile Apps | แอปบน Android, iOS และ Windows ช่วยให้เข้าถึงแดชบอร์ดแบบเรียลไทม์ได้ทุกที่ |
| Power BI Gateway | เกตเวย์สำหรับซิงก์ข้อมูลภายนอกเข้า‑ออก Power BI และรองรับการรีเฟรชอัตโนมัติ รวมถึงใช้งานร่วมกับ Power Automate / Power Apps ในองค์กร |
| Power BI Embedded | ใช้ REST API ฝังแดชบอร์ดและรายงานลงในแอปพลิเคชันของคุณ เพื่อมอบประสบการณ์ BI ให้ทั้งผู้ใช้ Power BI และผู้ใช้ทั่วไป |
| Power BI Report Server | โซลูชันรายงาน On‑Premises สำหรับองค์กรที่ไม่ต้องการหรือไม่สามารถเก็บข้อมูลบนคลาวด์ |
| Power BI Premium | การจัดสรรทรัพยากรตามความจุ (Capacity‑based) ช่วยเผยแพร่รายงานให้ผู้ใช้จำนวนมากได้โดยไม่ต้องซื้อไลเซนส์รายบุคคล |
| Power BI Visuals Marketplace | ตลาดรวมคัสตอมวิชวล (รวมถึงวิชวลที่ใช้ R) เพื่อขยายความสามารถด้านการสร้างภาพข้อมูล |
คุณสมบัติและความสามารถหลักของ Power BI
Power BI มีคุณสมบัติหลากหลายที่ช่วยให้องค์กรเปลี่ยนข้อมูลดิบเป็นข้อมูลเชิงลึก
- A. การเชื่อมต่อข้อมูลที่กว้างขวาง: รองรับแหล่งข้อมูลจำนวนมาก เช่น ไฟล์ (Excel, CSV), ฐานข้อมูล (SQL Server, Oracle), บริการ Azure และบริการออนไลน์ (Salesforce, Google Analytics) (ดูตารางที่ 1 สำหรับรายละเอียด)
- B. การเตรียมและการแปลงข้อมูล (Power Query และภาษา M): Power Query เป็นเครื่องมือ ETL ใน Power BI Desktop สำหรับเชื่อมต่อ แปลง และทำความสะอาดข้อมูลผ่าน UI หรือภาษา M สำหรับตรรกะที่ซับซ้อน
- C. การสร้างแบบจำลองและการวิเคราะห์ข้อมูล (DAX และความสัมพันธ์): กำหนดความสัมพันธ์ระหว่างตารางและใช้ DAX สร้างหน่วยวัดและคอลัมน์จากการคำนวณเพื่อเพิ่มตรรกะทางธุรกิจและการวิเคราะห์ขั้นสูง
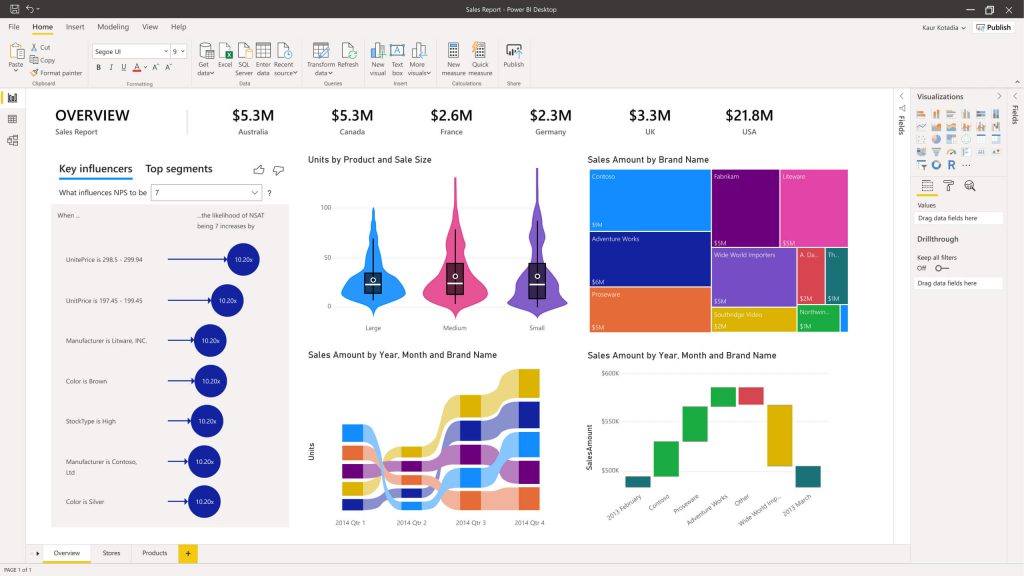
- D. การสร้างภาพข้อมูลแบบโต้ตอบ: นำเสนอการสร้างภาพข้อมูลหลากหลายประเภท (แผนภูมิแท่ง, เส้น, แผนที่ ฯลฯ) ที่เป็นแบบโต้ตอบ ทำให้ผู้ใช้สามารถกรองข้ามและสำรวจข้อมูลได้ สามารถนำเข้าภาพแบบกำหนดเองได้
- E. AI และการวิเคราะห์ขั้นสูง: ผสานรวมคุณสมบัติ AI เช่น AI Visuals (Key Influencers), Q&A (Natural Language Query), Quick Insights และการรวม Azure Machine Learning เพื่อค้นพบข้อมูลเชิงลึกและสร้างการคาดการณ์
- F. คุณสมบัติการทำงานร่วมกันและการแบ่งปัน: รายงานและแดชบอร์ดสามารถเผยแพร่ไปยัง Power BI Service แบ่งปันผ่านพื้นที่ทำงาน (Workspaces) และ Power BI Apps รวมทั้งผสานรวมกับ Microsoft Teams
- G. ความปลอดภัยและการกำกับดูแล: มีการรักษาความปลอดภัยระดับแถว (RLS) การผสานรวมกับ Microsoft Entra ID ป้ายกำกับระดับความลับ และการเข้ารหัสข้อมูล
- H. การสตรีมข้อมูลแบบเรียลไทม์: รองรับแดชบอร์ดแบบเรียลไทม์จากแหล่งสตรีมมิ่ง
- I. การผสานรวมกับระบบนิเวศของ Microsoft: ผสานรวมอย่างลึกซึ้งกับ Excel, Teams, SharePoint และบริการ Azur
| หมวดหมู่ (Category) | แหล่งข้อมูลเฉพาะ (Specific Data Sources) | ประเภทการเชื่อมต่อ (Connection Type) |
| ไฟล์ (Files) | Excel, CSV, XML, JSON, PDF, โฟลเดอร์ SharePoint | Import |
| ฐานข้อมูล (Databases) | SQL Server, Azure SQL Database, Oracle, MySQL, PostgreSQL, IBM Db2, SAP HANA, Teradata, Amazon Redshift, Google BigQuery, Snowflake | Import, DirectQuery |
| Azure | Azure Synapse Analytics, Azure Data Lake Storage, Azure Cosmos DB, Azure Blob Storage, Azure Table Storage | Import, DirectQuery |
| บริการออนไลน์ (Online Services) | SharePoint Online List, Microsoft Exchange Online, Dynamics 365, Salesforce Objects/Reports, Google Analytics, Adobe Analytics | Import, DirectQuery (บางบริการ) |
| อื่นๆ (Other) | OData Feed, Web, Active Directory, R script, Python script | Import, DirectQuery (ขึ้นอยู่กับแหล่งข้อมูล) |

การทำความเข้าใจ License และราคาของ Power BI
Power BI มีสิทธิ์การใช้งานหลายรูปแบบเพื่อตอบสนองความต้องการที่แตกต่างกัน
- Power BI Free: ฟรี สำหรับใช้งานส่วนบุคคล สร้างรายงานใน “My Workspace” ไม่สามารถแบ่งปันหรือทำงานร่วมกันได้
- Power BI Pro: ราคาพิเศษ 5,100 บาท/ปี สำหรับเผยแพร่ แบ่งปัน ทำงานร่วมกัน ขีดจำกัดแบบจำลอง 10GB รีเฟรช 8 ครั้ง/วัน
- Power BI Premium Per User (PPU): 24.00 ดอลลาร์สหรัฐ/ผู้ใช้/เดือน (ชำระรายปี) คุณสมบัติ Pro + Premium Capacity ส่วนใหญ่ แบ่งปันได้เฉพาะกับผู้ใช้ PPU อื่น
- Power BI Premium Per Capacity: เริ่มต้นประมาณ 5,000 ดอลลาร์สหรัฐ/เดือน (P1 SKU) ให้ทรัพยากรเฉพาะ แบ่งปันกับผู้ใช้ Free ได้ เหมาะสำหรับองค์กรขนาดใหญ่
- Power BI Embedded: เรียกเก็บเงินรายชั่วโมงตาม “A” SKUs สำหรับฝังการวิเคราะห์ในแอปพลิเคชันของตนเอง ผู้ใช้แอปไม่จำเป็นต้องมีสิทธิ์ Power BI
- สิทธิ์การใช้งาน Microsoft Fabric Capacity: Fabric Capacities (“F” SKUs) จัดซื้อตามหน่วยประมวลผล (CUs) F64 SKU ขึ้นไปอนุญาตให้แบ่งปันกับผู้ใช้ Free ผู้เผยแพร่ยังคงต้องมีสิทธิ์ Pro
เปรียบเทียบสิทธิ์การใช้งาน Power BI
| คุณสมบัติ (Feature) | Free | Pro | Premium Per User (PPU) | Premium/Fabric Capacity (เช่น F64+) | Embedded |
| การสร้างรายงาน (Desktop) | ✓ | ✓ | ✓ | ✓ | ✓ (สำหรับนักพัฒนา) |
| การเผยแพร่และแบ่งปันเนื้อหา | ✗ | ✓ | ✓ | ✓ | ✓ (ผ่านแอปพลิเคชัน) |
| การทำงานร่วมกัน | ✗ | ✓ (กับผู้ใช้ Pro/PPU) | ✓ (กับผู้ใช้ PPU) | ✓ (กับผู้ใช้ Pro/PPU/Free) | ผ่านแอปพลิเคชัน |
| คุณสมบัติ AI | พื้นฐาน | พื้นฐาน | ✓ (ขั้นสูง) | ✓ (ขั้นสูง) | ขึ้นอยู่กับการตั้งค่า |
| ขีดจำกัดขนาดแบบจำลอง | 1 GB (My Workspace) | 1 GB | 100 GB | สูงสุด 400 GB (ขึ้นอยู่กับ SKU) | ขึ้นอยู่กับ SKU |
| อัตราการรีเฟรช | 8 ครั้ง/วัน (My Workspace) | 8 ครั้ง/วัน | 48 ครั้ง/วัน | 48 ครั้ง/วัน | 48 ครั้ง/วัน |
| พื้นที่เก็บข้อมูลสูงสุด | 10 GB (My Workspace) | 10 GB/ผู้ใช้ | 100 TB (รวม) | 100 TB (รวมสำหรับ Power BI ใน Fabric) | ขึ้นอยู่กับ SKU |
| การเข้าถึงสำหรับผู้ใช้ Free | ✓ (บริโภคใน Premium/Fabric) | ✗ (ยกเว้นใน Premium/Fabric) | ✗ (ยกเว้นใน Premium/Fabric) | ✓ | ✓ (ผู้ใช้ปลายทางของแอป) |
| ค่าใช้จ่ายต่อผู้ใช้/เดือน (โดยประมาณ) | ฟรี | $14.00 | $24.00 | – | – |
| ค่าใช้จ่ายต่อ Capacity/เดือน (โดยประมาณ) | – | – | – | เริ่มต้น ~$5,000 (P1)/ผันแปรตาม F SKU | ผันแปรตาม A SKU |
| กลุ่มผู้ใช้/องค์กรเป้าหมาย | บุคคล, ผู้เรียนรู้ | ผู้ใช้รายบุคคล, ทีมขนาดเล็ก | ผู้เชี่ยวชาญข้อมูล, องค์กรขนาดเล็ก-กลาง | องค์กรขนาดใหญ่, ผู้ชมจำนวนมาก | นักพัฒนา, ISVs |

Promotion Power BI:
คุ้ม 2 ต่อ พร้อมข้อเสนอสุดคุ้ม!
- ฟรี! การติดตั้งการใช้งาน Power BI Pro/ Premium Per User บนระบบ Cloud
- ฟรี! พร้อมอบรมการใช้งานออนไลน์ และการดูแลให้บริการตลอดระยะเวลาการใช้งาน
การเริ่มต้นใช้งาน Power BI
การเริ่มต้นใช้งาน Power BI นั้นตรงไปตรงมา มีเครื่องมือและแหล่งข้อมูลมากมาย
A. คู่มือเริ่มต้นทีละขั้นตอนสำหรับผู้เริ่มต้น:
- ดาวน์โหลดและติดตั้ง Power BI Desktop
- เชื่อมต่อกับข้อมูล (เช่น Excel) ผ่าน “Get Data”
- (ทางเลือก) แปลงข้อมูล ด้วย Power Query Editor
- โหลดข้อมูล เข้าสู่แบบจำลอง
- สร้างภาพข้อมูล โดยลากฟิลด์ไปยังพื้นที่ทำงานและเลือกประเภทการแสดงผล
- สร้างรายงาน จัดเรียงภาพ เพิ่มชื่อเรื่อง
- บันทึกรายงาน (.pbix)
- เผยแพร่ไปยัง Power BI Service
- (ใน Power BI Service) สร้างแดชบอร์ด โดยปักหมุดภาพจากรายงาน
B. แหล่งข้อมูลการเรียนรู้ที่สำคัญ:
- Microsoft Learn: เอกสาร บทช่วยสอน เส้นทางการเรียนรู้
- เอกสาร Power BI: คู่มือฉบับสมบูรณ์
- ชุมชน Microsoft Fabric: ฟอรัมถามตอบ แบ่งปันวิธีแก้ปัญหา
- ช่อง YouTube: ช่องทางการของ Microsoft Power BI และผู้มีส่วนร่วมในชุมชน
- การเรียนรู้แบบมีผู้สอน: หลักสูตรบน Microsoft Learn และแพลตฟอร์มอื่น
Power BI และ Microsoft Fabric: อนาคตของการวิเคราะห์แบบครบวงจร
Microsoft Fabric รวมเครื่องมือวิเคราะห์ต่างๆ ไว้ในแพลตฟอร์มเดียว โดย Power BI เป็นส่วนสำคัญ
A. ความรู้เบื้องต้นเกี่ยวกับ Microsoft Fabric และองค์ประกอบ: Microsoft Fabric คือแพลตฟอร์มการวิเคราะห์แบบครบวงจรบน SaaS ที่รวม Data Engineering, Data Factory, Data Science, Data Warehouse, Real-Time Intelligence และ Power BI
- OneLake: Data Lake แบบลอจิคัลเดียวสำหรับทั้งองค์กร ขจัดปัญหาข้อมูลกระจัดกระจาย รองรับ “Shortcuts” เพื่อเข้าถึงข้อมูลโดยไม่ต้องย้าย
- DirectLake Mode: โหมดจัดเก็บข้อมูลที่ให้ Power BI อ่านไฟล์ Delta Parquet จาก OneLake โดยตรง ทำให้เข้าถึงข้อมูลเกือบเรียลไทม์พร้อมประสิทธิภาพเทียบเท่าโหมด Import
B. การผสานรวม Power BI เข้ากับระบบนิเวศของ Fabric: Power BI เป็นประสบการณ์หลักใน Fabric รายการ Power BI ถูกจัดเก็บและจัดการในพื้นที่ทำงานของ Fabric แบบจำลองความหมายสามารถเชื่อมต่อกับข้อมูลใน Fabric Lakehouses/Warehouses ผ่าน DirectLake ใน Fabric ช่วยเตรียมและควบคุมการรีเฟรชข้อมูล
C. ประโยชน์ของ Fabric สำหรับผู้ใช้ Power BI: การวิเคราะห์แบบครบวงจร, OneLake, ประสบการณ์ผู้ใช้ที่สอดคล้องกัน, ความสามารถ AI ที่เพิ่มขึ้น (รวมถึง Copilot) และการบริหารจัดการแบบรวมศูนย์
D. สิทธิ์การใช้งาน Fabric ที่เกี่ยวข้องกับ Power BI: ยังคงต้องมีสิทธิ์ Pro เพื่อเผยแพร่เนื้อหาไปยัง Fabric Fabric Capacities (F64+) อนุญาตให้แบ่งปันกับผู้ใช้ Free สิทธิ์ PPU เป็นทางเลือก
การอัปเดตล่าสุดและแนวโน้มในอนาคตของ Power BI (ณ เดือนพฤษภาคม 2025)
Power BI พัฒนาอย่างต่อเนื่อง โดยเฉพาะการผสานรวมกับ Microsoft Fabric
A. คุณสมบัติหลักล่าสุด :
- Standalone Copilot ใน Power BI (Preview): ประสบการณ์ Copilot เต็มหน้าจอ ช่วยค้นหาและวิเคราะห์รายงาน แบบจำลองความหมาย แอป และ Data Agents ที่เข้าถึงได้
- Translytical Task Flows (Preview): ปุ่มในรายงาน Power BI สามารถเรียกใช้ Fabric User Data Functions เพื่อดำเนินการอัตโนมัติ รวมถึงการเขียนข้อมูลกลับ
- การปรับปรุง Direct Lake Live Editing / Relationship: แก้ไขแบบจำลอง Direct Lake แบบเรียลไทม์ สร้างความสัมพันธ์ง่ายขึ้น รวมตาราง Import กับ Direct Lake ได้
- การปรับปรุงด้านการแสดงผล: ปรับแต่งสีส่วนของเส้นในแผนภูมิเส้น ตัวเลือกปรับแต่งแผนที่ฐาน Azure Maps เพิ่มเติม
- AI Instructions สำหรับ Copilot: ผู้สร้างแบบจำลองให้บริบททางธุรกิจแก่ Copilot
B. บทบาทของ AI และ Copilot ในอนาคตของ Power BI: Copilot เป็นหัวใจสำคัญ ทำให้การวิเคราะห์ข้อมูลเป็นแบบการสนทนาและเข้าถึงง่ายขึ้น AI ถูกฝังอยู่ทั่ว Power BI เพื่อช่วยเตรียมข้อมูล สร้างข้อมูลเชิงลึก และสร้างรายงาน
C. แผนงานและวิสัยทัศน์ของ Microsoft สำหรับ Power BI และ Fabric:
- เครื่องมือ Fabric Roadmap ใหม่ ให้ข้อมูลอัปเดตแบบเรียลไทม์
- การรวมศูนย์บริการข้อมูลและการวิเคราะห์ใน Microsoft Fabric โดย Power BI เป็นประสบการณ์ BI หลัก
- เน้นการกำกับดูแลระดับองค์กร ความปลอดภัย และความสามารถในการปรับขนาดใน Fabric
- เลิกใช้ Power BI Desktop รุ่น 32 บิตภายในสิงหาคม 2025
สรุป: เหตุใด Power BI จึงยังคงเป็นแพลตฟอร์ม BI ชั้นนำ
Power BI เป็นหนึ่งในแพลตฟอร์ม BI ชั้นนำด้วยชุดเครื่องมือที่ครอบคลุม การผสานรวมที่แข็งแกร่ง และการพัฒนาอย่างต่อเนื่อง
A. สรุปจุดแข็งที่สำคัญ:
- ชุดเครื่องมือที่ครอบคลุม: ตอบสนองผู้ใช้หลากหลายและครอบคลุมวงจรชีวิต BI
- การผสานรวมที่แข็งแกร่ง: กับระบบนิเวศ Microsoft และแหล่งข้อมูลหลากหลาย
- ความสมดุลระหว่างความง่ายในการใช้งานและพลัง: เหมาะทั้งผู้ใช้ธุรกิจและผู้ใช้ขั้นสูง
- การสร้างภาพข้อมูลและการรายงานแบบโต้ตอบ: ช่วยให้สำรวจและค้นพบข้อมูลเชิงลึก
- ความสามารถด้าน AI ที่เพิ่มขึ้น: Copilot และ AI อื่นๆ ทำให้การวิเคราะห์ขั้นสูงเข้าถึงง่าย
- สถาปัตยกรรมที่ปรับขนาดได้: โดยเฉพาะเมื่อรวมกับ Microsoft Fabric
- รูปแบบราคาที่แข่งขันได้: มีตัวเลือกที่คุ้มค่าสำหรับหลายองค์กร
- การสนับสนุนจากชุมชนและแหล่งข้อมูลการเรียนรู้ที่กว้างขวาง: ช่วยให้เรียนรู้และแก้ไขปัญหาได้
B. ข้อคิดสุดท้ายในการเลือก Power BI สำหรับความต้องการด้าน Business Intelligence ของคุณ: Power BI เป็นตัวเลือกที่น่าสนใจสำหรับองค์กรที่ต้องการควบคุมพลังของข้อมูล การผสานรวมกับ Microsoft Fabric ทำให้ Power BI อยู่ในระดับแนวหน้าของนวัตกรรม BI พิจารณา Power BI หากองค์กรของคุณให้ความสำคัญกับประสบการณ์การวิเคราะห์แบบครบวงจร การผสานรวมกับ Microsoft ความสมดุลของเครื่องมือ และข้อมูลเชิงลึกที่ขับเคลื่อนด้วย AI
AskMe และ Power BI
ที่ AskMe เราเป็นผู้เชี่ยวชาญด้านการให้บริการและโซลูชันของ Microsoft Power BI โดยให้บริการดังนี้:
การติดตั้งและปรับใช้ Power BI: ช่วยองค์กรของคุณในการติดตั้งและปรับใช้ Power BI ให้เหมาะสมกับความต้องการเฉพาะของธุรกิจ
การฝึกอบรมการใช้งาน Power BI: จัดหลักสูตรอบรมทั้งแบบ In-house และ Public Training เพื่อพัฒนาทักษะการใช้งาน Power BI ให้กับทีมงานของคุณ
การให้คำปรึกษาและสนับสนุน: ให้คำปรึกษาในการออกแบบแดชบอร์ดและรายงาน รวมถึงการสนับสนุนหลังการติดตั้งเพื่อให้การใช้งานเป็นไปอย่างราบรื่น
ทำไมต้องเลือก AskMe?
ประสบการณ์และความเชี่ยวชาญ: เรามีทีมงานที่มีประสบการณ์ในการให้บริการ Power BI แก่องค์กรหลากหลายขนาดและอุตสาหกรรม
การบริการที่ครบวงจร: ตั้งแต่การวางแผน ติดตั้ง ฝึกอบรม ไปจนถึงการสนับสนุนหลังการขาย
การปรับแต่งโซลูชันให้เหมาะสม: เราเข้าใจว่าทุกองค์กรมีความต้องการที่แตกต่างกัน จึงพร้อมปรับแต่งโซลูชันให้ตรงกับความต้องการของคุณ
สามารถติดต่อ AskMe ได้ทันทีเราเป็นผู้เชี่ยวชาญทางด้าน Microsoft Solutions ในประเทศไทย สามารถให้คำแนะนำและช่วยเหลือในการเลือกชุดผลิตภัณฑ์ที่เหมาะกับองค์กรของคุณ รวมถึงการติดตั้งและให้บริการหลังการขาย
สอบถามเพิ่มเติมหรือติดต่อขอใบเสนอราคาได้ที่
- กรุงเทพฯ โทร 02-245-1335-7
- ภาคเหนือ (เชียงใหม่) โทร 053-858-186
- ภาคตะวันออกเฉียงเหนือ (ขอนแก่น) โทร 096-415-4445
- ภาคตะวันออก (ชลบุรี/ระยอง) โทร 099-614-4995
- Email: sales@askme.co.th
- Line: @askme
รายละเอียดเพิ่มเติมเกี่ยวกับ Microsoft Power BI อ่านได้ที่นี่